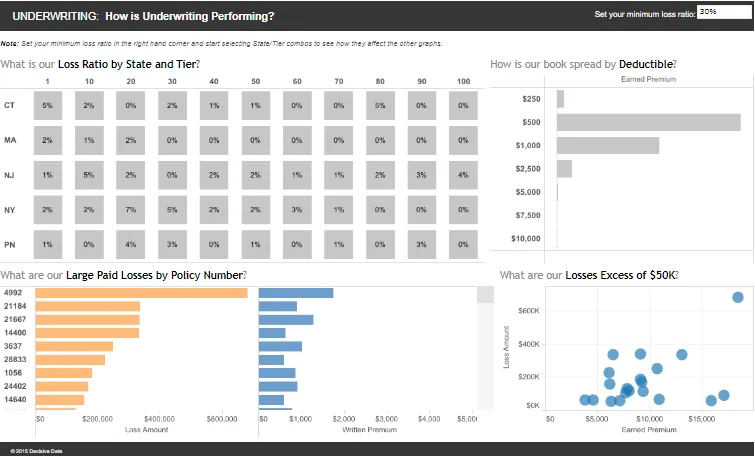
Insurance Analytics Dashboard
Improved customer retention by 40% through A/B-tested email-marketing automation, driven by an analytics dashboard for car-insurance customer data.
01.2019 — 12.2020Contract React developer — Better Lead LLC.
ReactData VisualizationAnalyticsAutomation
- Improved customer retention rates by 40% via the enhanced marketing system.
What I did
- Built an analytics dashboard for customer-data analysis in the car-insurance sector with React, D3.js, and Node.js.
- Developed custom business-logic modules to optimize email-marketing automation with A/B-tested campaigns.
The problem
Better Lead LLC works with customer data in the car-insurance sector, and their marketing decisions were running ahead of their tooling: the data existed, but there was no fast way to slice it, and email campaigns were tuned by instinct rather than evidence.
My approach
- The dashboard — I built an analytics dashboard in React with D3.js for visualizing customer segments, policy data, and campaign performance, backed by Node.js services.
- Business-logic modules — the interesting work was under the charts: custom modules encoding the client's segmentation rules, so the email-marketing automation could target customers by behavior instead of blasting a single list.
- A/B testing — I wired experimentation into the email flows so subject lines, timing, and segment definitions were compared with data rather than debated.
Challenges
- Domain encoding — insurance segmentation rules live in analysts' heads; the main challenge was turning that tacit knowledge into modules the automation could execute, and making the dashboard show why a customer landed in a segment.
Outcome
The dashboard became the client's day-to-day view of their customer base, and the A/B-tested email automation replaced guesswork in their retention campaigns.